
Figure 1.
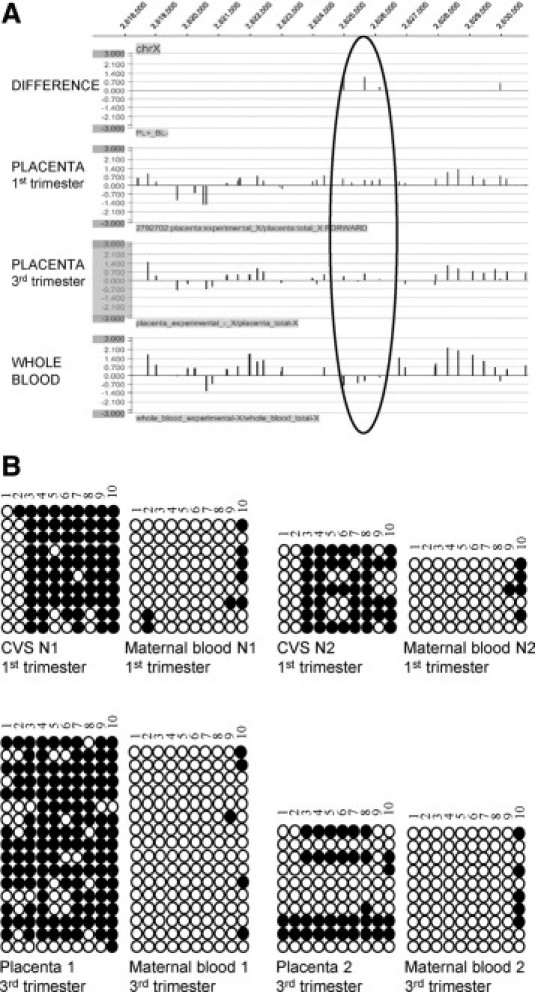
Analysis of the differential methylation status of the EF3 marker between placenta (first and third trimester) and whole blood. A: Differential methylation status analyzed by MeDiP-chip of the X chromosome genomic region indicated at the top. The black circle indicates the position of the region (2.624.944 bp to 2.626.149 bp, EF3) used for further analysis. Methylation differences between third-trimester placenta and whole blood and individual methylation status of whole blood, first-, and third-trimester placental DNA samples are indicated. B: Analysis of the methylation status of the EF3 sequence after bisulfite conversion of first- (up) and third- (down) trimester placental and maternal blood cell DNA. Two placental-maternal blood pairs were analyzed for each trimester [pairs N1 (46,XY) and N2 (46,XY) for the first trimester and pairs 1 (46,XX) and 2 (46,XY) for the third trimester]. Each row of circles indicates a single clone analyzed, while each column represents a single CpG site. Empty circles indicate unmethylated cytosines, whereas black circles represent methylated cytosines. CVS: chorionic villus sample.