
Figure 6.
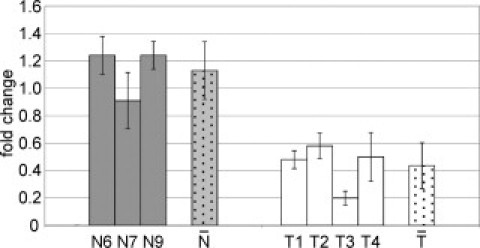
Detection of sex chromosomes/autosomes ratio in CVS of 45,X pregnancies after methylation-sensitive restriction digestion. Real-time PCR after methylation-sensitive restriction digestion. Same samples and calculations as in Figure 4, except that the Turner (45,X) T5 sample was omitted. (P = 0.0162 for T1, P = 0.0265 for T2, P = 0.0162 for T3, and P = 0.0265 for T4). Gray and white dotted bars ( vs
vs  ) indicate, respectively, the average fold changes for euploid and Turner samples (the two groups are significantly different with P = 0.0003).