Figure 1.

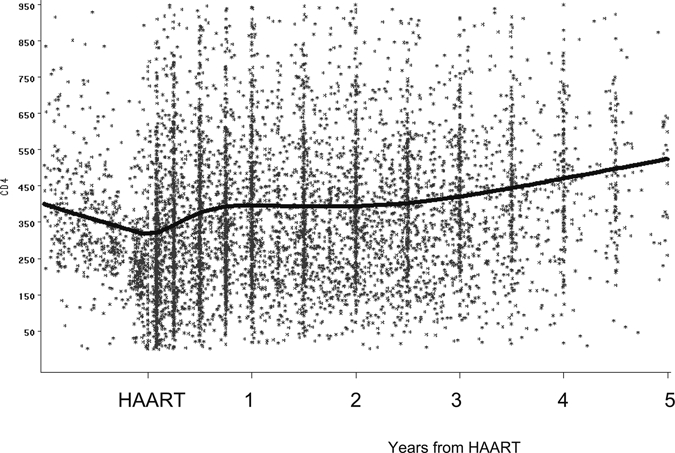
Locally weighted scatterplot smoothing curve describing CD4 cell count trends six months before (CD4 cell count baseline) and after start of highly active antiretroviral therapy for one year, Mozambique.

Locally weighted scatterplot smoothing curve describing CD4 cell count trends six months before (CD4 cell count baseline) and after start of highly active antiretroviral therapy for one year, Mozambique.