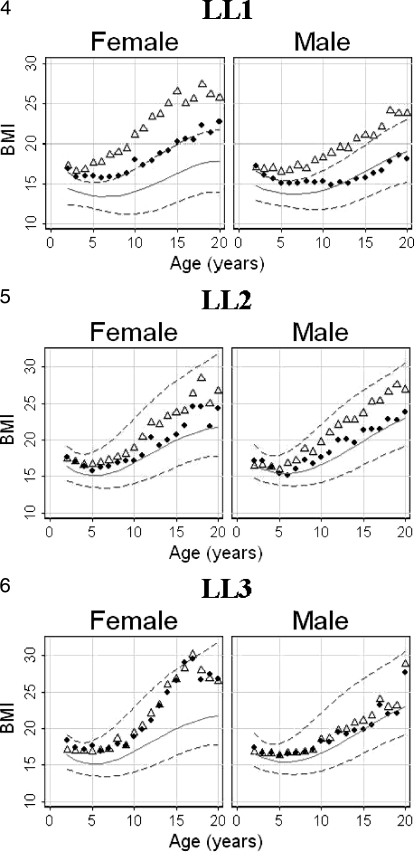
Figure 4–6.
Plots of body mass index (BMI) calculated by both arm span (♦) and height (▵) for each of the lesion level groups by sex and age are superimposed on Centers for Disease Control and Prevention/National Center for Health Statistics BMI percentile graphs. The background BMI graphs for the lesion level 1 male and female groups (Figure 4) have the percentiles lowered because of lost lean body mass, as explained in the text.

