
Figure 2.
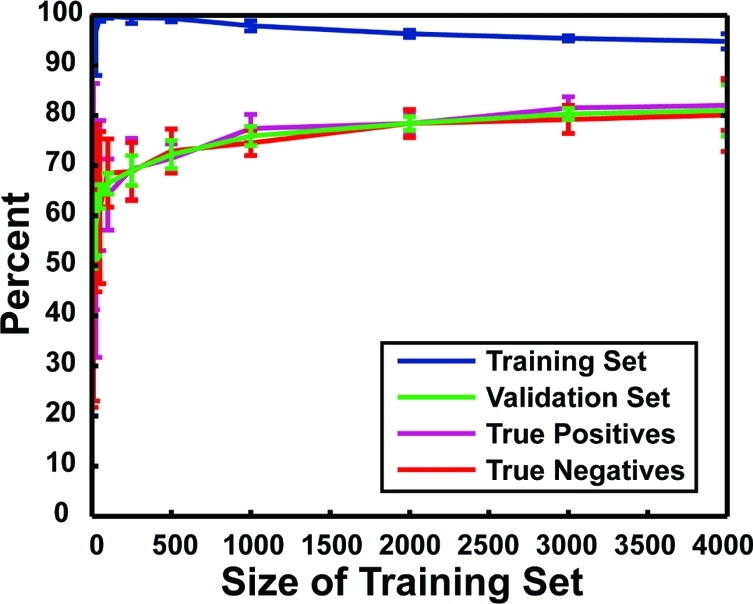
Accuracy of protein−ligand complex characterization. The x axis shows the size of the training set, and the y axis shows the percent accuracy. Each data point represents the average accuracy of 10 independent neural networks with one hidden layer of five neurodes. Error bars represent standard deviations. In blue are shown the accuracies with which the various networks were able to characterize the binding constants of the protein−ligand complexes in their respective training sets. In green are shown the accuracies with which the various networks were able to characterize the binding constants of the complexes in their respective validation sets. In purple is shown the likelihood that a given protein−ligand complex has a Kd value less than 25 μM given that the network predicts high-affinity binding (i.e., the true-positive rate when the respective validation sets were analyzed). In red is shown the likelihood that a given protein−ligand complex has a binding affinity greater than 25 μM given that the network predicts poor binding (i.e., the true-negative rate when the respective validation sets were analyzed).