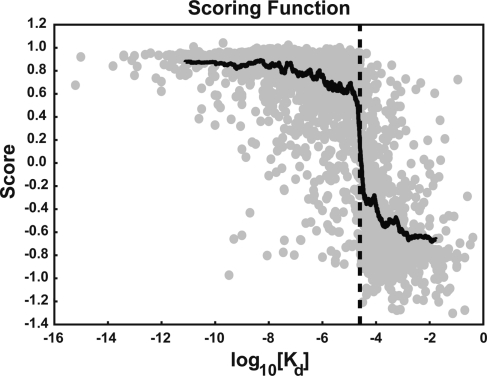
Figure 3.
Average score (N) over 24 networks as a function of the experimentally measured Kd value. To facilitate visualization, the data were ordered by log10(Kd) value. Moving averages of both the log10(Kd) values and the associated N values were calculated over 100 points. This data-averaged function (shown in black) crosses the x axis at 25 μM [log10(25 × 10−6) = −4.60, shown as a dotted line]. Individual, unaveraged data points are shown in gray.

