Fig. 5.
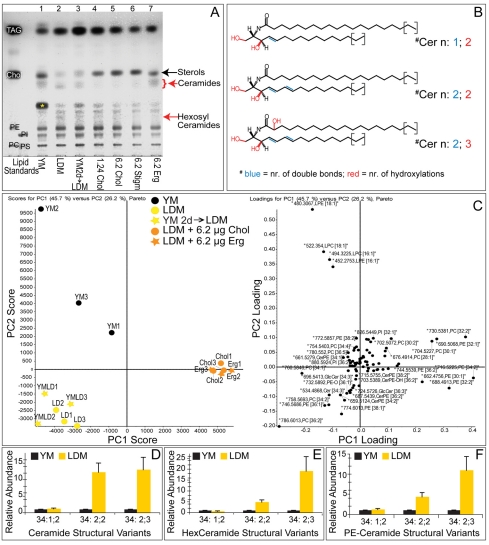
Sterol depletion induces specific changes in the Drosophila lipidome. (A) TLC of total membrane lipids from larvae fed with different media: lane 1, larvae fed YM until 4 days AEL (third instar); lane 2, larvae fed LDM until 4 days AEL (second instar); lane 3, larvae fed YM until 2 days AEL, then LDM for 6 days (third instar); lane 4, larvae fed LDM + 1.24 mg/ml cholesterol until 5 days AEL (third instar); lane 5, larvae fed LDM + 6.2 mg/ml cholesterol until 5 days AEL (third instar); lane 6, larvae fed LDM + 6.2 mg/ml stigmasterol until 5 days AEL (third instar); lane 7, larvae fed LDM + 6.2 mg/ml ergosterol until 5 days AEL (third instar). Red arrows indicate bands that appear in response to lipid depletion and that are decreased by sterol feeding. Asterisk indicates a band that increases in larvae fed YM. Standards are as in Fig. 1. (B) Structures of ceramides detected by mass spectrometry (other sphingolipids differ only in the headgroup). These lipids contain a long chain base (LCB) with either 14 or 16 carbon atoms and N-amidated fatty acid moieties of 18 to 24 carbon atoms. Major fatty acids are 20:0 and 22:0. (C) Principal component (PC) analysis of membrane lipids. Left panel: PCA plot. Right panel: Loading plot. Top-down analysis recognized 80 lipid peaks in membrane lipid extracts (three independent experiments). Larvae were fed YM, LDM for 4 days (LDM), YM until 2 days AEL then LDM for 6 days (YM 2d→LDM), LDM + 6.2 μg/ml cholesterol or LDM + 6.2 μg/ml ergosterol. Clustering of the yellow, orange and black points reveals diet-specific changes in fly membrane lipidome. Lipid abundance was normalized to median peak ratios of sample YM1. Selected representative response profiles of various lipids are shown in Fig. S6 in the supplementary material. (D-F) Relative abundance (determined by mass spectrometry) of membrane sphingolipids from larvae fed with YM or LDM (normalized to values for larvae fed on YM). Error bars indicate standard deviations.

