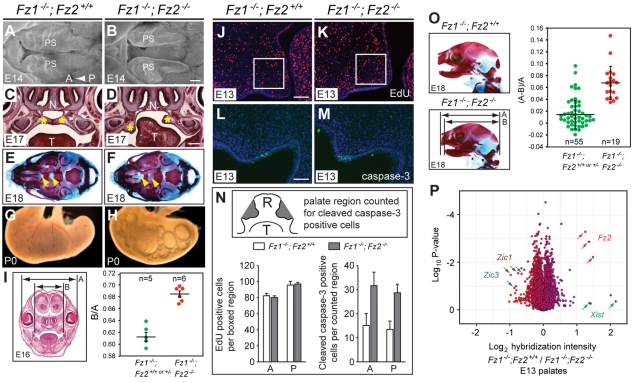
Fig. 3.
Craniofacial defects in Fz1–/–;Fz2–/– mice. (A,B) Scanning electron microscopy of the developing palate at E14 (ventral view). The palate shelves (PS) are partially closed in phenotypically wild-type Fz1–/–;Fz2+/+ embryos (A), but they show minimal movement towards the midline in a Fz1–/–;Fz2–/– littermate (B). A, anterior; P, posterior. (C,D) Coronal sections at E17. Yellow asterisks indicate palate shelves. N, nares; T, tongue. In the Fz1–/–;Fz2–/– embryo, failure of palate shelf elevation on the left side can be seen. (E,F) Ventral views of the skull at E18; palatine bones (yellow arrowheads) are missing in the Fz1–/–;Fz2–/– skull. (G,H) Characteristic accumulation of air bubbles in the stomach of an Fz1–/–;Fz2–/– mouse at P0. (I) Widening of the roof of the mouth in Fz1–/–;Fz2–/– mice with open palates compared with Fz1–/–;Fz2+/+ and Fz1–/–;Fz2+/– littermates with closed palates at E16. The relative distances between the upper molars (marked B) and the outer edges of the lenses (marked A) are plotted as the ratio B/A. P=1.4×10⁻⁴ (Student's t-test). (J-M) EdU incorporation (J,K; left palate shelf) and anti-cleaved caspase 3 (L,M; right palate shelf) in coronal sections through the anterior region of E13 Fz1–/–;Fz2+/+ and Fz1–/–;Fz2–/– palates. Boxes (J,K) indicate the area in which EdU-labeled cells were counted. (N) Mean ± s.d. of EdU (n=4 mice) and anti-cleaved caspase-3 (n=3 mice) labeled cells, from anterior (A) and posterior (P) regions of the palate. Inset is a schematic of a coronal section showing the palate shelf regions (gray) analyzed for anti-cleaved caspase-3-labeled cells. R, roof of the mouth; T, tongue. (O) Hypognathia in Fz1–/–;Fz2–/– mice at E18, compared with phenotypically wild-type Fz1–/–;Fz2+/+ littermates. Mean ± s.d. relative distances from the back of the skull to the anterior tip of the upper jaw (marked A) or lower jaw (marked B) [calculated as (A-B)/A]. P-value=2.2×10⁻⁷ (Student's t-test). (P) Microarray hybridization of RNA from E13 Fz1–/–;Fz2+/+ (wild type) versus Fz1–/–;Fz2–/– palates show minimal differences in three independent biological replicates with three to five bilateral palates pooled per sample. The scatter plot shows the log2 of the average of Fz1–/–;Fz2+/+ divided by Fz1–/–;Fz2–/– transcript abundances on the x-axis and the log10 P-value on the y-axis. Arrows indicate transcripts: red, Fz2; green, Xist; brown, Zic1; blue, Zic3. Scale bars: 200 μm in B; 500 μm in D; 100 μm in J; 50 μm in L.

