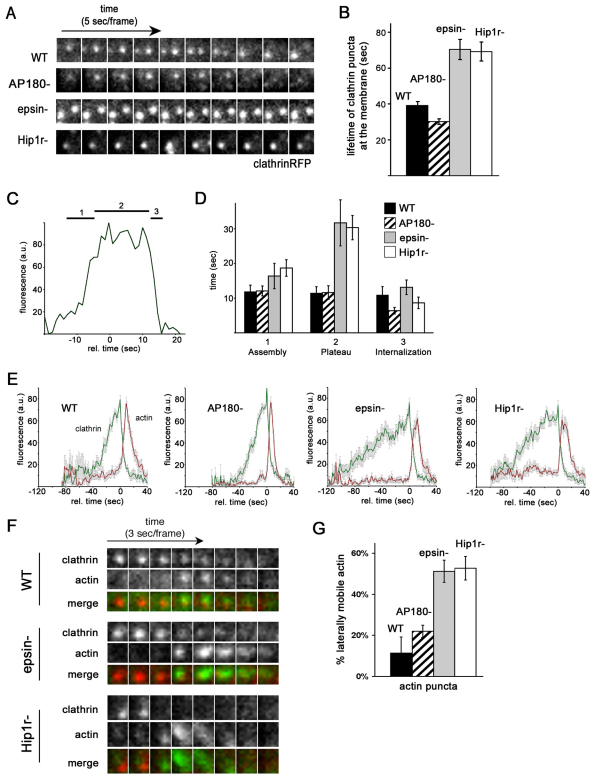
Fig. 2.
Hip1r and epsin, but not AP180, are required for normal clathrin and actin dynamics at the plasma membrane. (A) Clathrin puncta persist at the membrane of epsin and Hip1r-null cells. Time-lapse TIRF images of wild-type (WT), AP180-null (AP180−), epsin-null (epsin−), and Hip1r-null (Hip1r−) cells expressing clathrinRFP. (B) Quantification of the lifetime of clathrin puncta identified at the beginning of TIRF time-lapse acquisition. Wild-type (39±2 seconds, n=49; AP180-null (AP180−) 30±2 seconds, n=35; epsin-null (epsin−) 70±6 seconds, n=31; and Hip1r-null (Hip1r−) 68±4 seconds, n=29. (C) Representative plot showing the fluorescence intensity of a wild-type clathrinRFP (clathrin) punctum over time; 1, 2 and 3 mark the assembly, plateau and internalization phases, respectively. (D) Quantification of the average lifetime (seconds) of clathrin puncta from wild-type (n=20), AP180-null (n=20), epsin-null (n=16), and Hip1r-null (n=20) cells. Cells are in the assembly phase (1) with normalized intensities of 25–75 a.u.; plateau phase (2) with intensities above 75 a.u.; and internalization phase (3) with intensities of 75–25 a.u. (E) Average plots of the intensity of clathrinRFP (clathrin) puncta over time, with the accompanying actin puncta as labeled by limEΔcoilGFP (actin) in wild-type, AP180-null, epsin-null, and Hip1r-null cells; n=16–20 per cell line. (F) Time-lapse TIRF images of individual clathrin and actin puncta in wild-type, AP180-null, epsin-null, and Hip1r-null cells coexpressing clathrinRFP (clathrin) and limEΔcoilGFP (actin). (G) Quantification of laterally mobile actin puncta as labeled by limEΔcoilGFP: wild-type 11±8%, n=35 puncta on 5 cells; AP180-null 22±3%, n=39 puncta on 6 cells; epsin-null 56±6%, n=49 puncta on 5 cells; and Hip1r-null 53±6%, n=51 puncta on 6 cells. All values are mean ± s.e.m. All quantification was performed on cells from three independent experiments for each condition.

