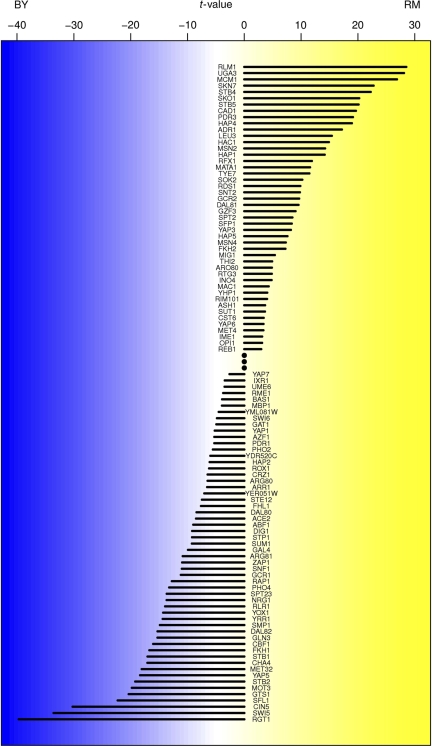
Figure 2.
Inferred differences in TF activity between the BY and RM parental strains. Shown are the t-values corresponding to the regression coefficients in a multivariate linear model that predicts genome-wide differential mRNA expression from predicted binding affinity of upstream promoter regions.

