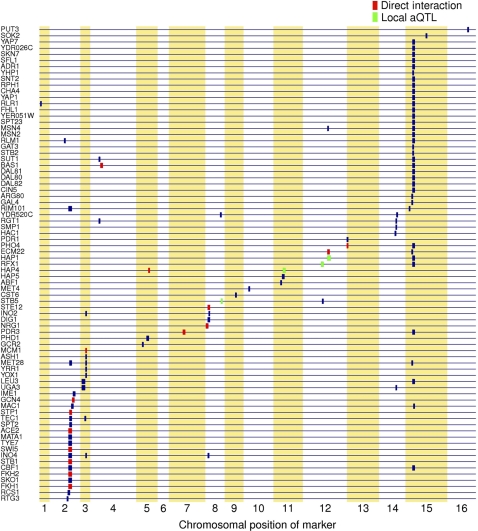
Figure 3.
Overview of the trans-acting genetic modulators of TF activity mapped using our method. All transcription factors that have at least one significant aQTL region at a 5% FDR are shown. Transcription factors are sorted according to the chromosomal position of their maximum LOD score. Putative causal gene assignments are indicated in green (local aQTL: TF encoded by gene in aQTL) or red (protein–protein interaction identified between TF and gene in aQTL).

