Figure 2.
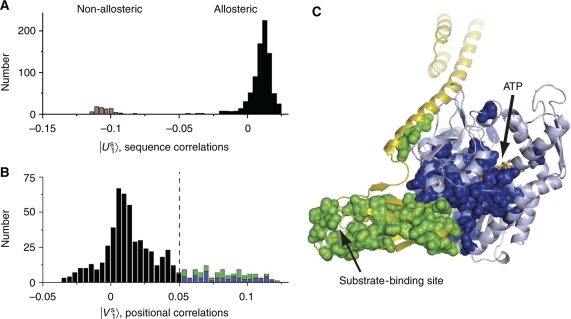
Identification of an allosteric sector in Hsp70 proteins. (A) A histogram of the Hsp70/110 sequences projected on a top axis of sequence variation derived from singular value decomposition and independent component analysis (see Box 1 Materials and methods). This axis separates family into two sub-families that correspond to the allosteric Hsp70s and the non-allosteric Hsp110s. (B) A histogram of Hsp70 residues projected on the corresponding axis of positional co-evolution, showing that a small fraction of residues is largely responsible for the sequence divergence shown in panel A (115 sector out of 605 total residues or ∼20%). This defines the Hsp70 sector. The sector nearly equally comprises residues from the nucleotide-binding domain (blue, 56 residues) and the substrate-binding domain (green, 59 residues). (C) The Hsp70 sector mapped onto a model of the ATP-bound state of E. coli DnaK. The sector forms a physically contiguous group of residues that connect the ATP-binding site in the nucleotide-binding domain (pale blue) to the substrate-binding pocket of the substrate-binding domain (yellow) through the binding interface between the two domains. Sector positions are represented as spheres and colored as in panel B. Source data is available for this figure at www.nature.com/msb.

