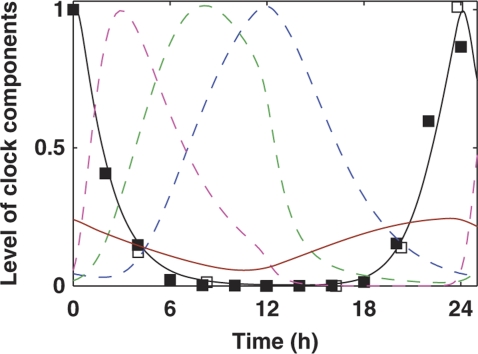
Figure 6.
Regulation of LHY/CCA1 expression by the wave of inhibitors and the activator TOC1mod. Simulations are shown during 12L:12D entrainment of wild-type plants. LHY/CCA1 mRNA is shown by the black line. Inhibitor proteins PRR9, PRR7 and NI are shown by dashed magenta, green and blue lines, respectively. TOC1mod is shown by the brown line. Experimental data on LHY/CCA1 expression are shown by filled squares (Edwards et al, 2010) and open squares (Farre et al, 2005).

