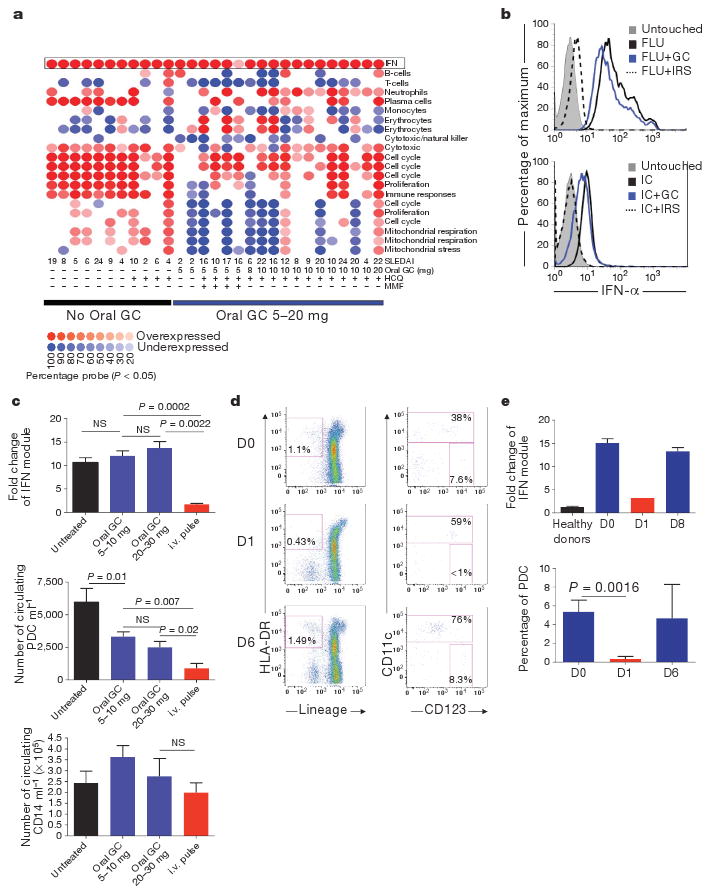
Figure 1. Level of expression of the PDC-induced IFN signature in glucocorticoid-treated SLE patients strictly correlates with circulating blood PDCs.

a, Module level analysis from whole blood from 29 SLE patients with (n = 18) or without (n = 11) oral glucocorticoid (GC) treatment as described10. Disease activity index (SLEDAI) and therapy used are indicated at the bottom. HCQ, hydroxychloroquine; MMF, mycophenolate mofetil. b, Purified PDCs were grown alone or with Flu or purified anti-RNP-IC either alone or with glucocorticoids (10−5 M) or IRS and assayed for IFN-α secretion at 3 h. c, Top panel: interferon module expression levels (average from transcripts within the IFN module displayed in a) in SLE patients untreated (n = 30), on 5–10 mg (n = 29) or on 20–30 mg (n = 6) daily oral Prednisone and on intravenous (i.v.) methylprednisolone pulse (three consecutive doses, n = 6). Middle and lower panels: blood PDC and monocyte numbers in SLE patients untreated (n = 13), on 5–10 mg daily oral glucocorticoids (n = 27), oral daily glucocorticoids 20–30 mg (n = 16) and the day after intravenous pulse (n = 6). NS, not significant. d, Representative flow cytometry analysis of PDCs before and 1 and 6 days after intravenous pulse. e, Top: quantification of the average interferon module level expression (Nanostring, see Supplementary Fig. 1) in healthy controls (n = 9), SLE patients before intravenous pulse (n = 26) and at day 1 (n = 1) and day 8 after the pulse (n = 2). Bottom: PDCs frequency in the CD11c population patients before intravenous pulse (D0, n = 10) and at day 1 (n = 9) and day 6 after pulse (n = 2). Data are plotted as mean ± s.e.m.
