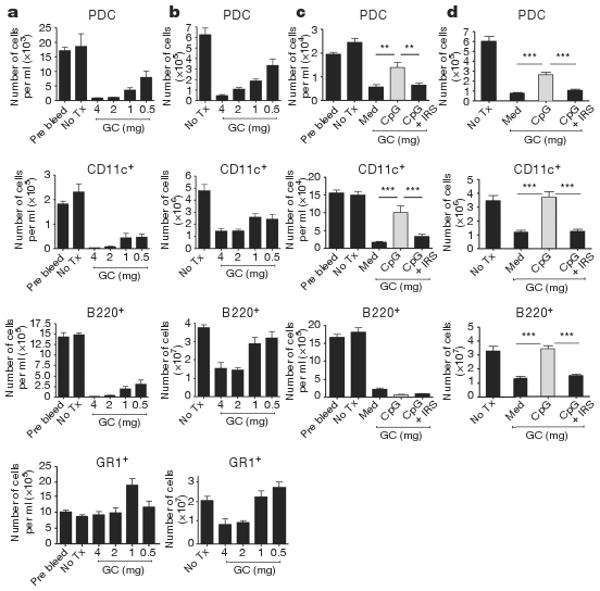
Figure 3. TLR9 activation in vivo renders PDCs more resistant to glucocorticoid treatment.

a, b,129 mice had no treatment (No Tx) or were injected with graded doses of dexamethasone and cells prepared from blood (a) or spleens (b) after 18 h. In blood (a), data are expressed as number of cells per ml of blood and as total number of cells in spleens (b). n = 6 mice per group. c, d, 129 mice were either left untreated or treated with 1 mg dexamethasone alone or in the presence of either CpG-C ISS (50 μg per mouse) or with CpG-C ISS plus IRS (100 μg per mouse). Number of cells per ml in blood is shown in (c) and total number of cells in spleen is shown in (d). Cumulative data of two independent experiments; n = 8 mice per group is shown. Plotted data represent averages ± s.e.m. ** P ≤ 0.01, *** P ≤ 0.001.
