Figure 6.
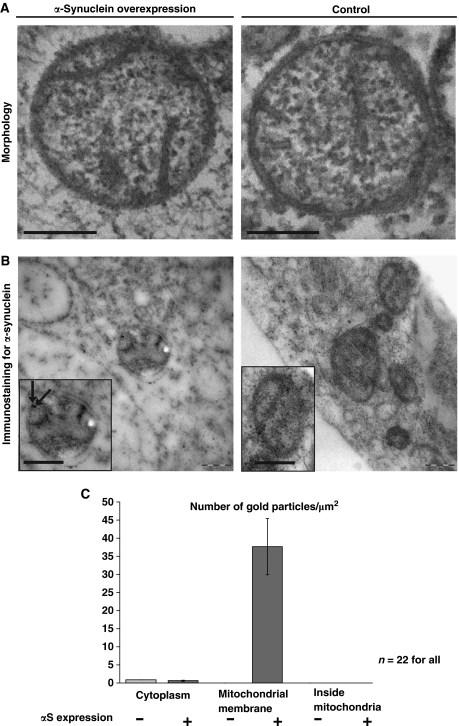
αS binds to mitochondrial outer membranes. (A) Electron microscopy of mitochondria in cells overexpressing αS (left panel) and without overexpression (control, right panel). Scale bars=200 nm. (B) Immunostaining for αS. Insets: Mitochondria in high magnification. Arrows indicate localization of αS. Scale bars=200 nm. (C) Statistical analysis of the density of immunogold labelling in the cytosol, at the mitochondrial membrane and inside the mitochondria, comparing αS overexpressing cells (+) and the control without overexpression (−). No label inside the mitochondria was detected in both samples. Error bars indicate s.d.

