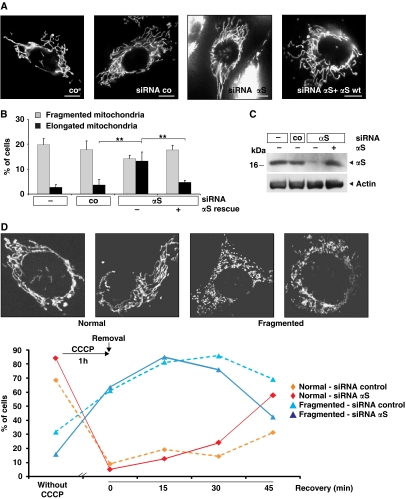
Figure 8.
Loss of αS induces elongation of mitochondria. (A) Images of fluorescently labelled mitochondria. The panels display representative individual cells either untransfected (co) or transfected with control-siRNA, αS-siRNA, and αS-siRNA+αS-cDNA. Scale bar=10 μm. (B) Statistical analyses of mitochondrial morphology of cells from the experiments shown in (A). Approximately 300 cells of each experiment were counted, and the relative amount of cells with changed mitochondrial morphology (i.e. fragmentation or elongation) was determined. Error bars indicate s.d. (C) Downregulation of αS in SH-SY5Y cells and retransfection with wild-type αS was monitored by western blotting using β-actin as a loading control. (D) Analyses of mitochondrial morphology of cells transfected with a control siRNA or an siRNA against αS before exposure to 10 μM CCCP for 1 h and at different recovery times after removal of CCCP. Insets show images of fluorescently labelled mitochondria. The panels display representative mitochondrial phenotypes as observed before (normal) and after (fragmented) exposure to CCCP. Scale bars=10 μm. Approximately 60 cells of each experiment were counted, and the relative amount of transfected cells with normal or fragmented mitochondrial morphology was determined. **P⩽0.01.

