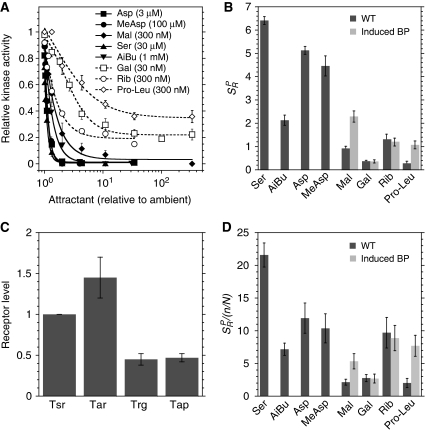
Figure 3.
Response sensitivity of major and minor receptors. (A) Dose-response curves for cells that were pre-adapted to an ambient concentration of the respective ligand around the peak of the dynamic range (shown in brackets). Kinase activity is plotted as a function of final ligand concentration, normalized to the respective ambient concentration. (B) Response sensitivity at the peak of the dynamic range, SRP, for WT and otherwise wild-type cells each expressing a plasmid-encoded periplasmic binding protein (BP) at maximum induction of 10 μM salicylate. See text for the definition of SRP. (C) Native expression levels of receptors in wild-type cells normalized to Tsr, determined by immunoblot as described in Materials and methods and in Supplementary Figure S4. (D) SRP values from (B) normalized to the receptor fraction. Error bars indicate standard errors.

