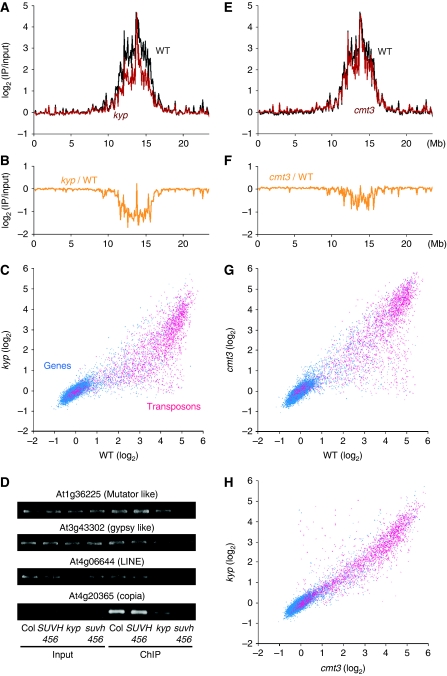
Figure 2.
Effects of kyp and cmt3 mutations on H3K9me2 level. (A, B) Global view of H3K9me2 patterns along the chromosome 3, compared between wild type and kyp. Average signals in each 100 kb regions (A) or the differences of the signals between wild type and kyp (B) were plotted. (C) H3K9me2 levels in genes (blue dots) and transposons (red dots), compared between wild type and kyp. (D) H3K9me2 levels in wild type (Col), wild-type sibling of suvh456 (SUVH456), kyp, and suvh456 triple mutant examined with ChIP-PCR. Amplifications from input control and ChIP DNA are shown. (E, F) Global view of H3K9me2 patterns in wild type and cmt3 (E) or the difference in H3K9me2 between wild type and cmt3 (F). (G, H) H3K9me2 levels in genes (blue dots) and transposons (red dots), compared between wild type and cmt3 (G) or cmt3 and kyp (H).

