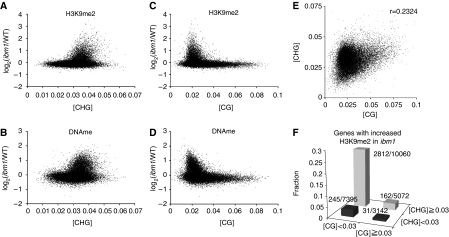
Figure 4.
[CHG] and [CG] correlate with the effect of ibm1 on H3K9me2. (A, B) Relationships between [CHG] and the ibm1-induced changes in H3K9me2 (A) or DNA methylation (B) level in each gene. (C, D) Relationships between [CG] and the ibm1-induced changes in H3K9me2 (C) or DNA methylation (D) level in each gene. The effects of [CHG] and [CG] are independent of the effect of gene length (Supplementary Figure S8A–D). (E) Positive correlation between [CHG] and [CG]. (F) The proportion of genes with increased H3K9me2 in ibm1 (Supplementary Figure S3A), within four gene groups with high and low [CHG] and [CG]. Actual gene numbers (ibm1 affected/all) in each group are also indicated.

