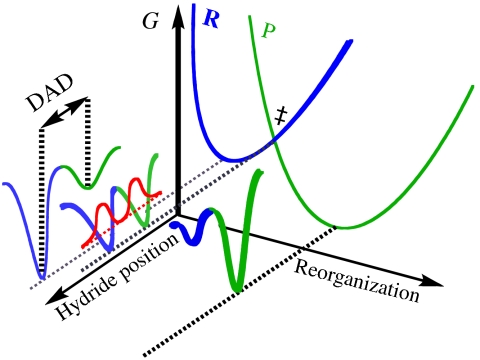
Fig. 1.
An illustration of the Marcus-like model. The reorganization axis indicates the motions of the heavy atoms that carry the system to the tunneling-ready configuration (TRC, ‡). The hydride transfer axis shows the two wells in the hydride coordinate that are separated by the donor-acceptor distance (DAD). R and P are the reactant and product diabatic surfaces, respectively. The red curves show the hydrogen nuclear wave functions in the reactant and product wells in the tunneling ready configuration. The overlap between them is proportional to the tunneling probability.

