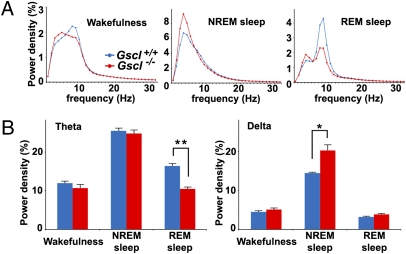
Fig. 3.
EEG spectral analysis of Gscl−/− mice. (A) EEG spectral profiles of Gscl+/+ mice (blue line, n = 12) and Gscl−/− mice (red line, n = 6) during wakefulness (Left), NREM sleep (Center), and REM sleep (Right). The average EEG spectra were normalized to total EEG power from 1–32 Hz in 1-Hz bins. (B) Gscl−/− mice (red bar) exhibited a reduced power density in the theta frequency band (Left) during REM sleep and a greater power density in the delta frequency band (Right) during NREM sleep, when compared with Gscl+/+ mice (blue bar). Data (mean + SEM) were analyzed with ANOVA followed by the Tukey post hoc test. *P < 0.05; **P < 0.005.

