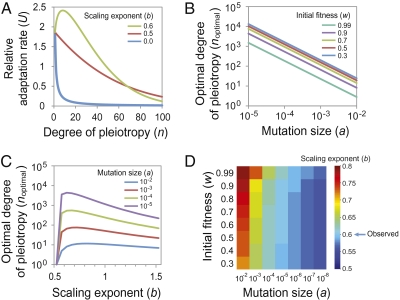
Fig. 4.
The “cost of complexity” is alleviated when the scaling exponent b > 0.5. (A) The relative adaptation rate as a function of the degree of pleiotropy (n) changes with the scaling exponent b. The relative adaptation rate is calculated using Orr's formula. The initial fitness w is set at 0.9 and the mutation size a is set at 0.01. (B) The optimal degree of pleiotropy noptimal, defined as the degree of pleiotropy that corresponds to the highest adaptation rate, changes with the mutation size a. Different curves are generated using different initial fitness (w) values but the same b = 0.6. (C) The optimal degree of pleiotropy noptimal changes with different b. Different curves are generated using different a but the same w = 0.9. (D) A heat map showing the b value that provides the maximal noptimal, given a and w.

