
Fig. 2.

Results from computational simulation of an AVA implanted scaffold. (A) Orientation of implanted scaffold in a mouse that underwent ischemic hind-limb surgery. The orientation of the scaffold was chosen to create an angiogenic zone directly over the section of the femoral artery that was ligated—with a goal of creating new blood vessels that would bypass the ligated vessel. The spatially restricted APR was designed to limit angiogenesis in other limb regions that presumably would not provide perfusion recovery function. The axes definitions are such that x is perpendicular to the severed femoral artery and vein, y is parallel to the femoral artery and vein, and positive z points away from the underlying muscle. Note that the x-y plane lies tangential to the interface between the scaffold and the underlying muscle, and that the coordinate (0,0,2.1 mm) is located at the center of the scaffold. Simulation results of the concentration profiles of (B) total VEGF, (C) free VEGF, and (D) free anti-VEGF over time at y = 0 and z = -0.5 mm. (E) Cross-sectional plots of concentration profiles of total anti-VEGF (blue solid) and free anti-VEGF (green dashed) at 3, 7, 14, and 21 d. (F) Cross-sectional plots of concentration profiles of total VEGF (blue solid) and free VEGF (green dashed) at 3, 7, 14, and 21 d. (G) The maximum concentrations of total VEGF and free VEGF over time. (H) APR at 1, 7, and 14 d for AVA (Left) and BVB (Right). The angiogenic promotion signal is defined as 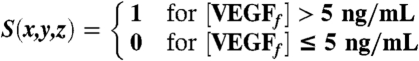 .
.