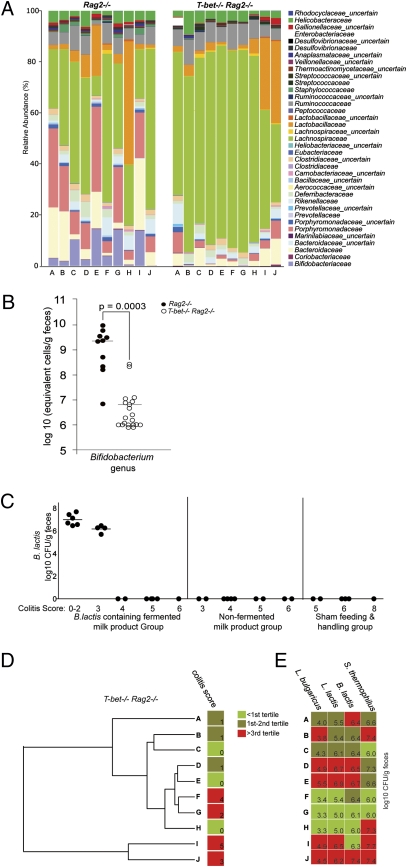
Fig. 4.
Structure of gut microbiota influences response to B. lactis-containing fermented milk product. (A) Distribution of family-level phylotypes in T-bet−/−Rag2−/− and Rag2−/− fecal microbiota at 4 wk of age (preconsumption). Percent relative abundance is plotted. (B) Bifidobacterium levels (qPCR) from 4-wk-old T-bet−/−Rag2−/− (n = 20) (○) and Rag2−/− (n = 10) (●) fecal samples. (C) B. lactis counts (log10CFU/g feces) (y axis) of sufficient quantity from mice in Fig. 1. Mice grouped by product administered and colitis score (x axis). Each circle represents a single mouse; horizontal bars show the mean. (D) Family-level hierarchical clustering analysis of T-bet−/−Rag2−/− fecal microbial communities before product consumption. Each sample is labeled corresponding to its relative abundance data in A, and colitis scores postconsumption are heat map color coded based on tertile distribution. (E) Postconsumption recovery levels of BFMP strains are heat map color coded based on tertile distribution for the corresponding sample in A and D.

