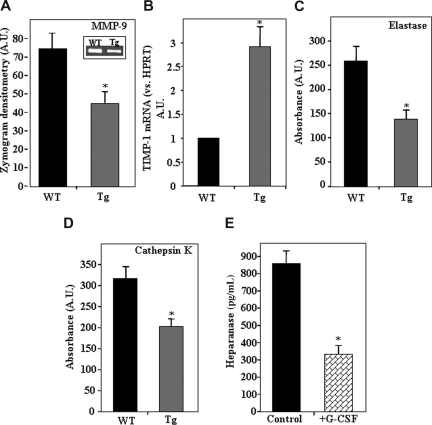
Figure 3.
Decreased protease activity resulting from heparanase overexpression.(A) Average levels of MMP-9 activity in the BM supernatant of WT (control) and hpa-Tg mice. Inset shows a representative gelatin zymography experiment. Data are means plus or minus SE; n = 6 samples. (B) mRNA levels of TIMP-1 in BM cells from WT or hpa-Tg mice. Data are means plus or minus SE; n = 3. (C) Levels of elastase activity in the BM supernatant of WT and hpa-Tg mice. Average absorbance (arbitrary units) is shown. Data are means plus or minus SE; n = 6 samples. (D) Levels of cathepsin K activity in the BM supernatant of WT and hpa-Tg mice. Average absorbance (arbitrary units) is shown. Data are means plus or minus SE; n = 12 samples. (E) Heparanase levels in BM supernatant of mice treated with G-CSF (compared with control nontreated mice), determined by ELISA. Data are means plus or minus SE; n = 3 mice (*P < .05).

