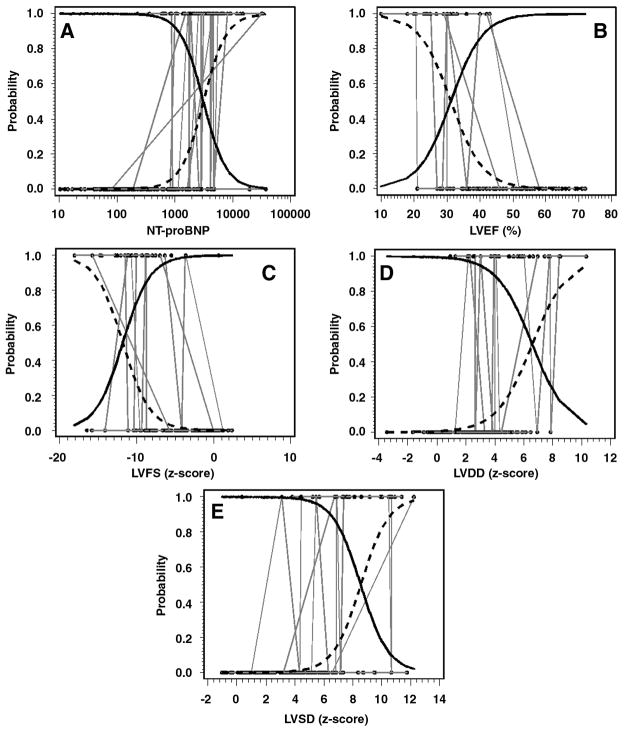
Figure 2.
(Panels A–E). Bivariate relationships between the probabilities of being in NYHA/Ross class I/II versus III/IV by NT-proBNP on a log10 scale and echocardiographic measurements. Solid (Probability of being in NYHA/Ross class I/II) and dashed (Probability of being in NYHA/Ross class III/IV) logistic curves show the within-subject relationships in a hypothetical average subject (i.e., a subject having a random intercept of zero) estimated from these data using logistic-normal, generalized linear mixed models. The black dots are the probability of being in NYHA/Ross class III/IV for an individual subject, which was 1 if the subject was in NYHA/Ross class III/IV at a particular observation and 0 otherwise, plotted against actual measurements of the predictor. Repetitive measurements within individual subjects are connected by gray lines. The solid and dashed logistic curves cross at the value of the predictor for which the hypothetical average subject has a 50% chance of being in NYHA/Ross class III/IV.

