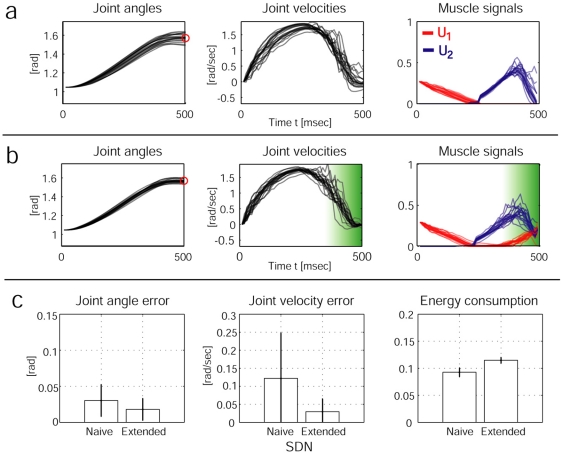
Figure 3. Comparison of the results from stochastic OFC using standard SDN (a) and extended SDN (b).
We performed 50 OFC reaching movements (only 20 trajectories plotted) under both stochastic conditions. The shaded green area indicates the region and amount of co-contraction in the extended SDN solution. The plots in (c) quantify the results (mean +/− standard deviation). Left: average joint angle error (absolute values) at final time T = 500 msec. Middle: Joint angle velocity (absolute values) at time T. Right: integrated muscle commands (of both muscles) over trials. The extended SDN outperforms the reaching performance of the standard SDN case at the expense of higher energy consumption.

