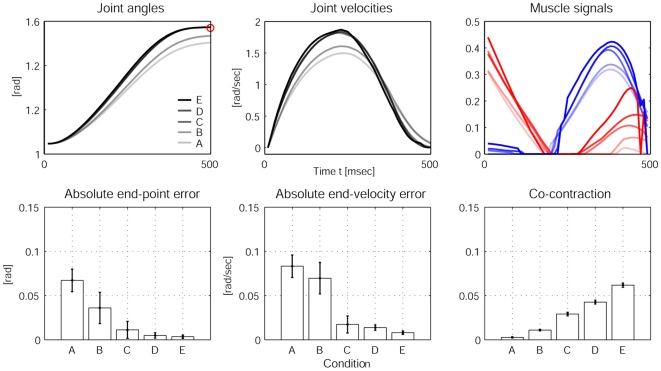
Figure 4. Experimental results from stochastic OFC-LD for different accuracy demands.
The first row of plots shows the averaged joint angles (left), the averaged joint velocities (middle) and the averaged muscle signals (right) over 20 trials for the five conditions A, B, C, D, and E. The darkness of the lines indicates the level of accuracy; the brightest line indicates condition A, the darkest condition E. The bar plots in the second row average the reaching performance over 20 trials for each condition. Left: The absolute end-point error and the end-point variability in the trajectories decreases as accuracy demands are increased; Middle: End-point stability also increases (demonstrated by decreasing error in final velocities); Right: The averaged co-contraction integrated during 500 msec increases with higher accuracy demands, leading to the reciprocal relationship between accuracy and impedance control as observed in humans.

