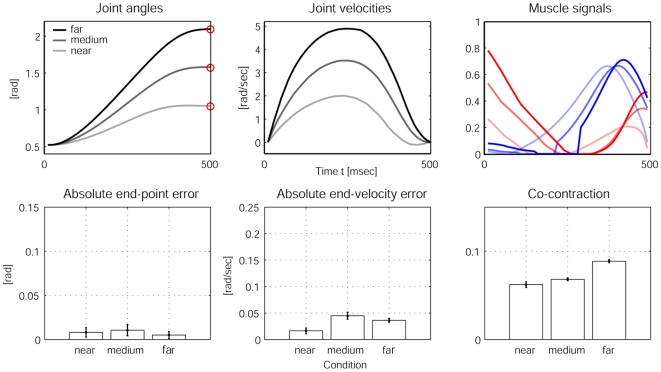
Figure 5. Experimental results from stochastic OFC-LD for different peak joint velocities.
The first row of plots shows the averaged joint angles (left), the averaged joint velocities (middle) and the averaged muscle signals (right) over 20 trials for reaches towards the three target conditions “near”, “medium” and “far”. The darkest line indicates “far”, the brightest indicates the “near” condition. The bar plots in the second row quantify the reaching performance averaged over 20 trials for each condition. The end-point errors (left) and end-velocity errors (middle) show good performance but no significant differences between the conditions, while co-contraction during the motion as expected increases with higher velocities, due to the higher levels of muscle signals.

