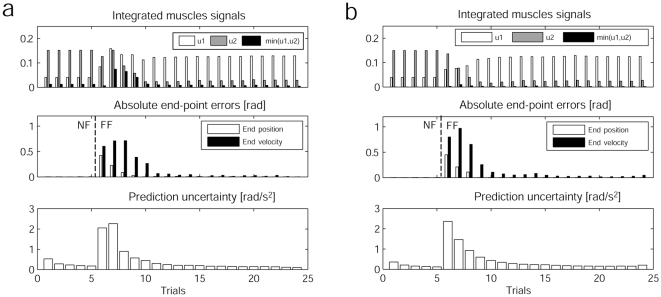
Figure 7. Adaptation results.
(a) Accumulated statistics during 25 adaptation trials using stochastic OFC-LD. Trials 1 to 5 are performed in the NF condition. Top: Muscle activations and co-contraction integrated during 500ms reaches. Middle: Absolute joint errors and velocity errors at final time T = 500ms. Bottom: Integrated (internal model) prediction uncertainties along the current optimal trajectory, after this has been updated. (b) The same statistics for the adaptation using deterministic OFC-LD, meaning no uncertainty information is used for the optimization. This leads to no co-contraction and therefore worse reaching performance during adaptation.

