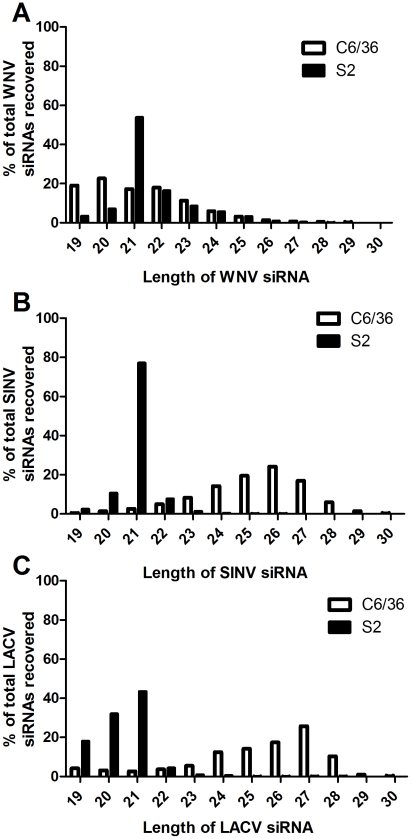
Figure 1. Size and abundance of small RNA reads Mmapping to the viral genomes.
The abundance of 19–30-mer sRNA reads mapping to the WNV (A), SINV (B) and LACV (C) genomes based on size. Abundance is represented as a percentage of the total viRNAs from each sample. The black bars correspond with samples collected from S2 cells and white bars from C6/36 cells.

