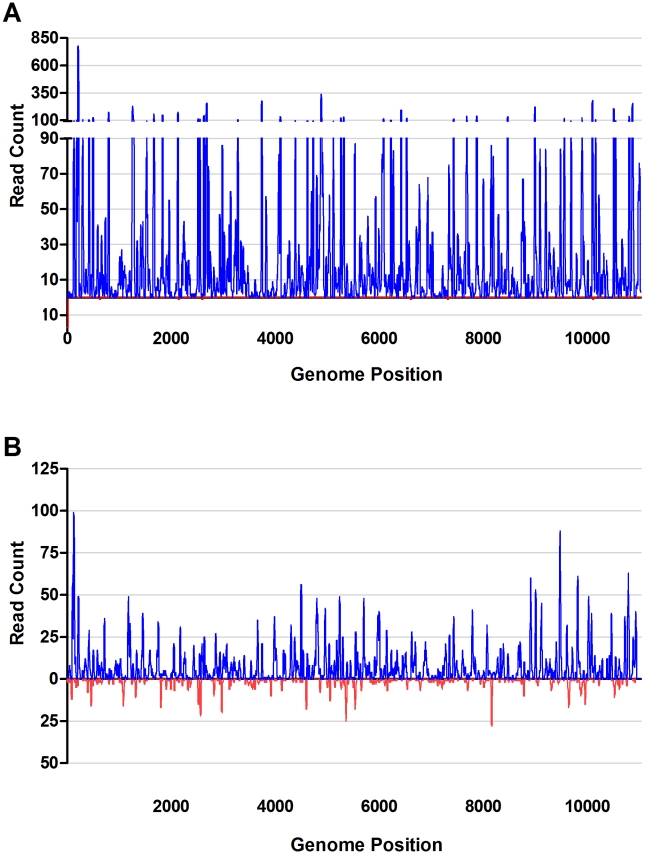
Figure 2. viRNA coverage of the WNV genome in C6/36 and S2 cells.
Complete genome of WNV (11,029 nt.) showing intensity at each nucleotide of the genome in C6/36 (A) and S2 (B) cells. Plotted are the 19–30-mer viRNA reads. Reads originating from the genomic, positive strand are represented in blue above the x-axis and those originating from the negative strand are represented in red below the x-axis.

