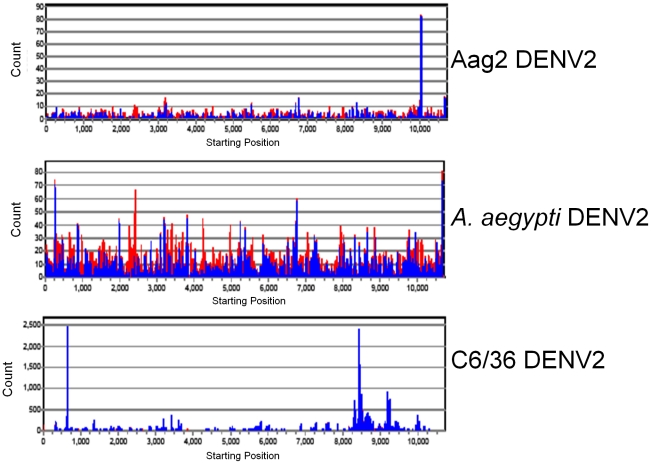
Figure 3. viRNA genome coverage distribution varies among DENV2-infected Aag2 and C6/36 cell cultures and Aedes aegypti mosquitoes.
viRNA coverage across DENV genome for each library. Shown are Aag2 (5 dpi) library, C6/36 (5 dpi) library, A. aegypti (9 dpi) library. Red bars, negative-sense viRNAs; blue bars, positive-sense viRNAs. Note differences in Y-axes among graphs.

