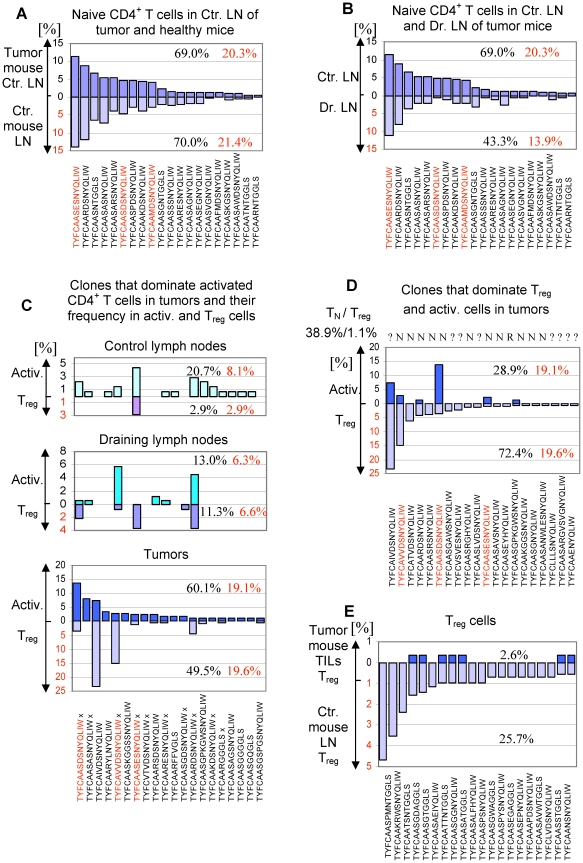
Figure 5. Analysis of the TCR repertoire in tumor-bearing TCRmini-Foxp3GFP mice.
Sequences of the TCRα chain CDR3 regions are shown below plots, red sequences mark T cell clones specific for Ep63K peptide. Numbers indicate the percentage of clones shown on the plot (black) and the percentage of the Ep63K-specific cells (red) in the total population of the T cell subset analyzed. (A) Naive CD4+ T cells in healthy and tumor-bearing TCRmini-Foxp3GFP mice express similar TCR repertoires. Frequencies (%) of the 20 most abundant clones in control lymph nodes of mice with tumors (dark purple) and in lymph nodes of healthy mice (light purple) are shown. (B) Comparison of TCR repertoires of naive CD4+ T cells in the control (dark purple) and the draining lymph nodes (light purple) of TCRmini-Foxp3GFP mice with tumors. 20 most abundant clones in the control lymph nodes is shown. (C) Analysis of frequency of activated (Activ.) and Treg cell clones in control (upper panel) and draining (middle panel) lymph nodes and tumors (lower panel). 20 most abundant clones in the population of activated T cells in tumors was selected for analysis. TCRs marked with “x” were also found in B16 tumors not expressing Ep63K epitope. (D) The abundance of T cell clones expressing TCRs shared with naive/effector CD4+ T cells (N) or expressing TCRs exclusive for the Treg subset (R) in the populations of activated (blue, upper part of the panel) and Treg (purple, lower part of the panel) cells in tumors. Clones selected for analysis are the 20 most abundant clones in the population of Treg cells in tumors. Receptors found in naive/effector T cells (N) and Treg cells (R) are shown above the plot. Receptors not assigned to any subset are labeled “?”. (E) The frequency of Treg clones (blue) expressing the exclusive set of TCRs in tumors. Clones selected for analysis are the 20 most abundant clones in the population of Treg cells in healthy mice (purple).

