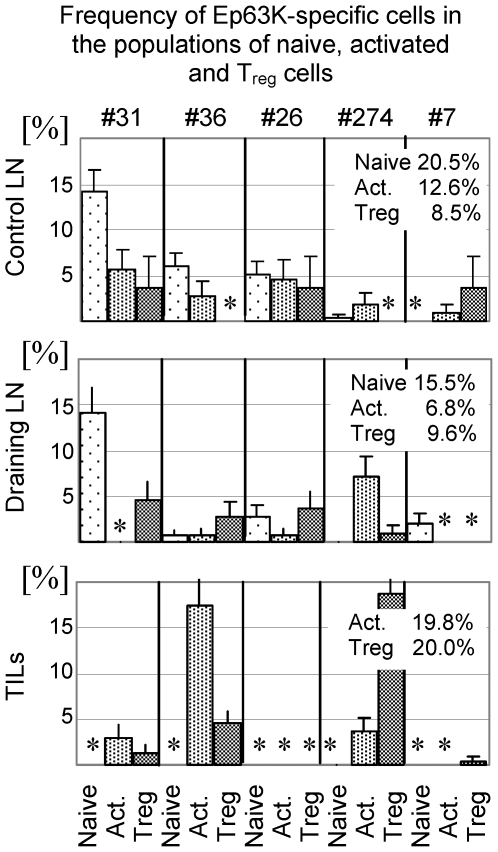
Figure 6. Clonal abundance (%) of Ep63K-specific T cell clones in naive (sparse dots), activated (dense dots) and Treg (stripes) subsets in the control and draining lymph nodes and tumors of tumor-bearing TCRmini-Foxp3GFP mice.
The percentage of all Ep63K-specific clones in populations of naive, activated and Treg cells is shown on each plot. Names of hybridomas expressing a particular TCRα chain are shown above upper panel. Asterisks indicate that no clones were found in the indicated cell subsets.

