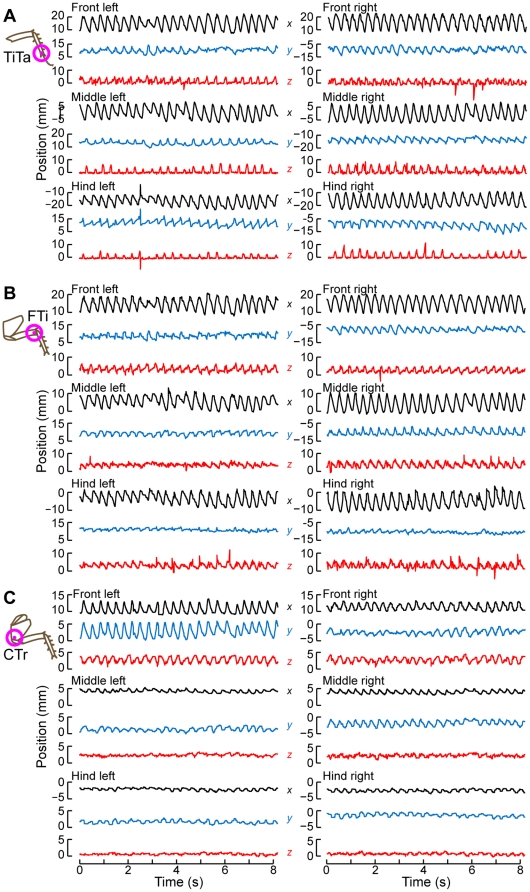
Figure 6. Time-series of leg positions during the same bout shown in Fig. 5 .
The black traces show the x (forward-back) positions of the points; red: y (right-left) positions; blue: z (up-down) positions for (A) the TiTa point, (B) the FTi point, and (C) the CTr point.

