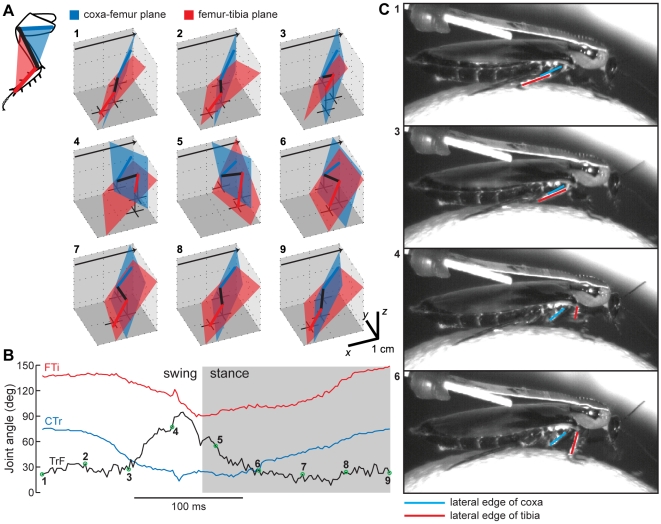
Figure 7. The measurement and action of the TrF joint.
(A) For one stride by the right middle leg, the motion of the leg is depicted in 3D as a stick figure. Leg segments and planes are colored as in the inset (top left). The plane formed by the ThC-CTr-FTi points is blue, and the plane formed by the CTr-FTi-TiTa points is red. The TrF angle is defined as the angle between these two planes. The black crosses show the projection of the CTr, FTi, and TiTa points onto the ground plane, with a vertical black line connecting each cross to its corresponding joint. The black arrows point toward the animal's head. (B) The FTi, TrF, and CTr joint angles over the same stride plotted in panel A. The 9 colored points correspond to the 9 stick figures in A. (C) High-speed video of one stride by a cockroach walking on an air-floated Styrofoam ball. The lateral edges of the tibia and the coxa were painted with white paint to increase contrast, and are overlaid with red and blue lines here, respectively. The 4 video frames were chosen to approximate the step phases shown by the appropriately numbered points in panels A and B. The red and blue lines are parallel in the top two frames, and rotated in the bottom two frames. This rotation corresponds to reduction at the TrF joint.

