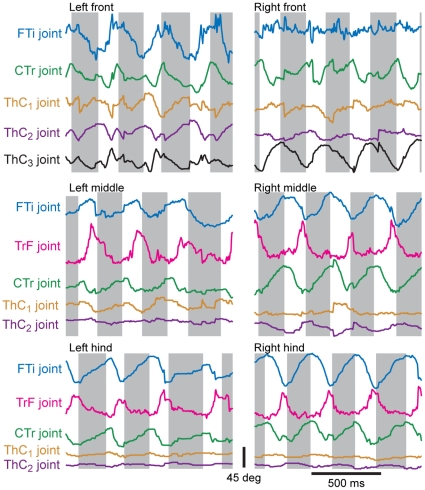
Figure 10. Joint angles calculated from 3D joint positions during a portion of the same walking bout shown in Fig. 5 .
As in Fig. 8, the colored points represent successive frames of tracked video. The gray boxes indicate the stance phase of each stride, defined using the z-position of the TiTa point. The FTi joint angle (blue) was estimated using the CTr, FTi, and TiTa points. The TrF joint angle (pink) was estimated using the CTr-FTi-TiTa plane and the coxal plane. The CTr angle (black) was estimated using the ThC, CTr, and FTi points. The angle of the coxa in the xz-plane centered at the ThC position was used to define the motion in the first degree of freedom (promotion/remotion) of the ThC joint (ThC1, green), and the declination of the coxa from the xy-plane determined its motion in the ThC joint's second degree of freedom (ThC2, orange).

