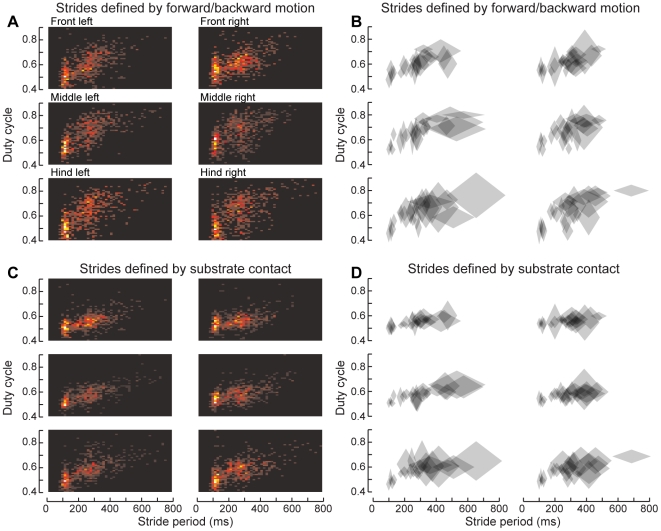
Figure 11. The duty cycle of the feet changes with walking speed.
(A) 2D histogram of the duty cycle for each stride, plotted versus that stride's duration. Warmer colors indicate more strides in a given bin (total 763 strides from 25 bouts of walking by 8 animals). The duty cycle indicates the fraction of each stride during which the foot was on the ground, and generally decreases with increasing speed (or decreasing period). Here, the stance phase was calculated by AEP and PEP, as for the green boxes in Fig. 8. (B) Duty cycle, pooled by trial. Each diamond represents the mean and s.e.m. of both stride period and duty cycle for a single bout of walking. (C) Same data as panel A, but with stance phase determined by the TiTa points' z-values, as for the gray boxes in Fig. 8. (D) Same as panel B, but using z-values to delineate strides.

