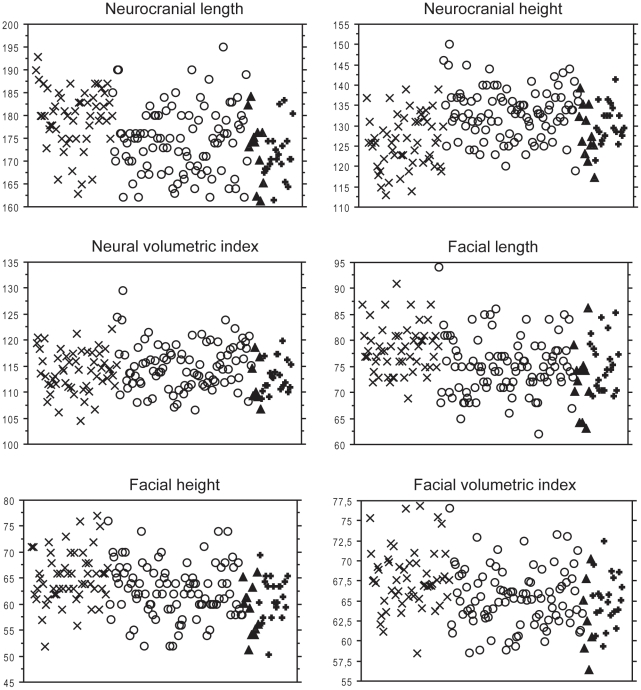
Figure 4. Values distribution for major cranial components.
X: Eastern non-pygmies; O: Western non-pygmies; Δ: Eastern pygmies; +: Western pygmies. Minimum and maximum values are respectively as follows: Neurocranial length (163–193) (162–195) (161–184) (161–183), Neurocranial height (113–139) (119–150) (117–139) (121–141), Neural volumetric index (105–122) (107–130) (107–118) (108–119), Facial length (69–91) (62–94) (63–86) (69–85), Facial height (52–77) (52–76) (51–66) (50–69), Facial volumetric index (58–77) (58–77) (56–70) (59–72).

