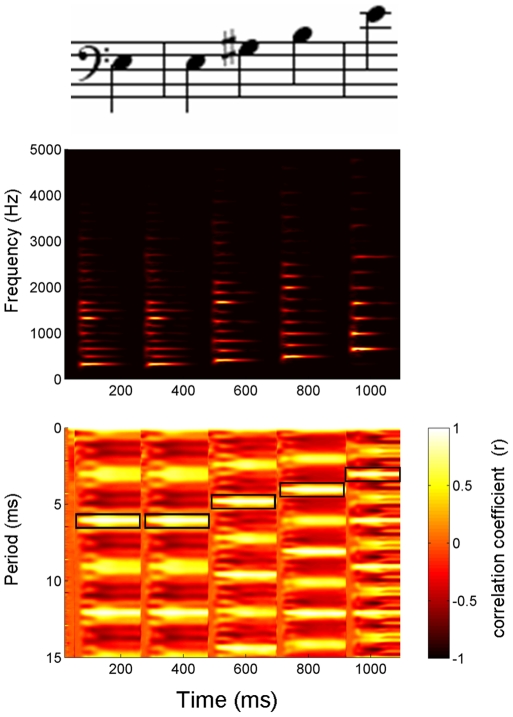
Figure 1. Description of the stimulus.
(Top) The melody was composed of piano five notes, E3-E3-G#3-B3-E4. Notes 1 and 2 were acoustically identical. (Middle) Each ∼220 ms note had a rich harmonic structure that was dominated by the second harmonic (H2) (330, 330, 416, 494, 660 Hz, respectively), the lowest frequency in the spectrum of this “missing fundamental” stimulus. (Bottom) As shown in the stimulus autocorrelogram, the amplitudes of the harmonics interact to create a signal that is strongly modulated at the period of the fundamental frequency (F0), as evidenced by the brightest bands of color occurring at periods of 6.06, 6.06, 4.81, 4.05, 3.03 ms, respectively (marked by black boxes). The reciprocal of these periods correspond to 165, 165, 208, 247, 330 Hz, respectively. Following procedures described in Kraus and Skoe (2010) [45], the autocorrelogram was generated using a sliding-window cross-correlation function. The first time window encapsulated 0–40 ms of the stimulus, with each subsequent window starting 1 ms after the previous. Each 40-ms time window was cross-correlated with itself and degree of correlation at each time shift (y-axis) is plotted using a color scale, such that white represents the highest correlation. In this plot, the x-axis values refer to the center of each window (e.g., window 1 at 20 ms, window 2 at 21 ms, etc.) and the y-axis values refer to the time shift of the autocorrelation function.

