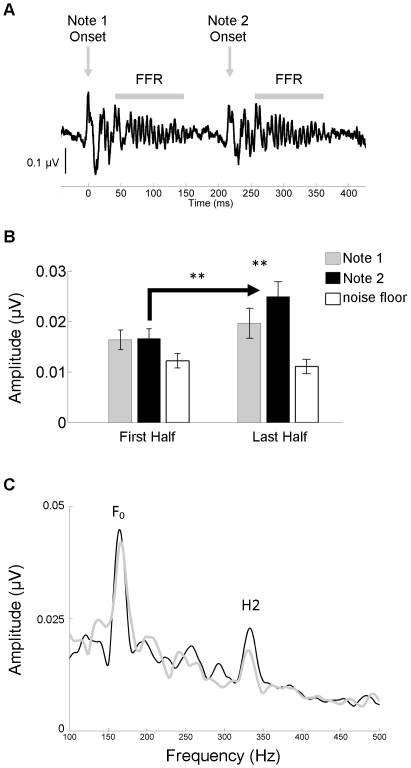
Figure 4. Local repetition enhancement over time.
(A) The onset and frequency-following responses (FFRs) are plotted here in the time domain for Notes 1 and 2. In the stimulus, Notes 1 and 2 are identical in all respects. (B) The FFRs to Notes 1 and 2 did not differ in terms of the amplitude of second harmonic (H2) during the first half of the recording (left), but they did differ during the second half (right). While both Notes increased in amplitude over the recording session, the Note 2 enhancement was most pronounced (an average of 21.34% and 64.80% increase, respectively). This enhancement was not the result of increased activity in the noise floor (white bars represent the noise floor for Note 2 during the first and last halves). (C) The grand average spectrum for the last half of the recording is plotted for Notes 1 (gray) and 2 (black). The spectral peaks corresponding to the fundamental frequency (F0) and H2 are labeled.

