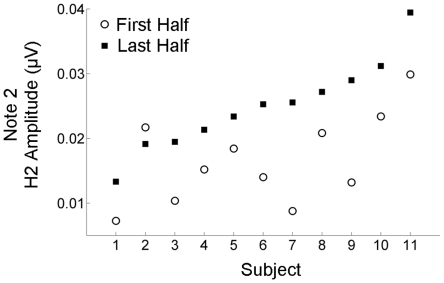
Figure 5. Time-dependent local enhancement of Note 2 in individual participants.
For the frequency-following response to Note 2, the second harmonic (H2) amplitude is plotted for the first (open circles) and last (black squares) halves of the recording. The H2 enhancement, which ranged from 21.1–65.5%, was observed in 91% of the participants (10/11).

