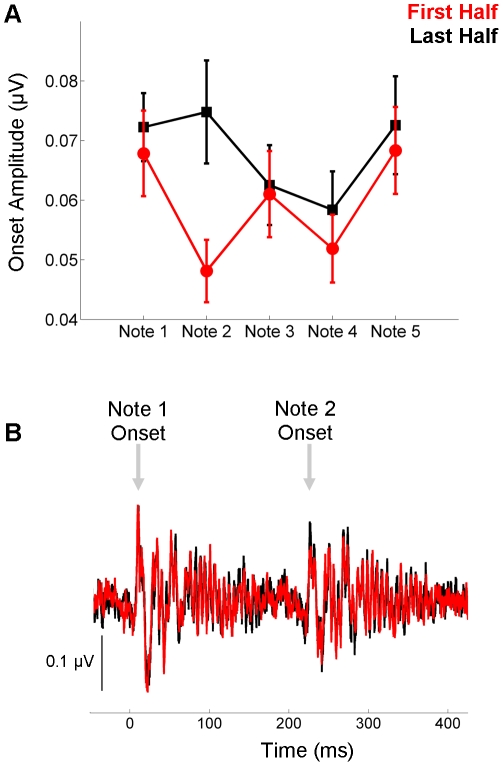
Figure 7. Repetition effects for the onset response.
(A) For all notes, the onset response was larger during the second half of the recording session (red) compared to the first half (black). (B) As shown here in the time domain waveforms, the onset response to Note 2 is markedly bigger during the second half of the recording compared to the first.

