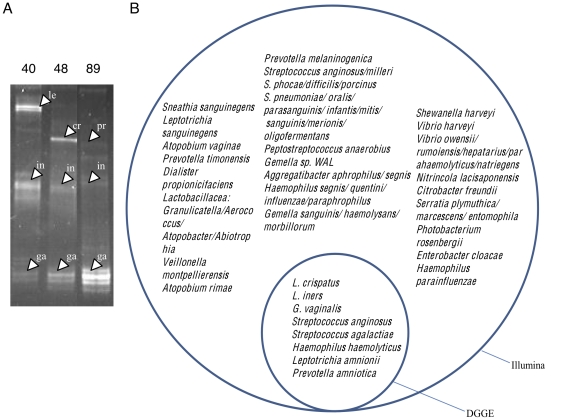
Figure 13. DGGE analysis of selected samples.
Panel A shows representative PCR amplicons from 3 of 20 clinical samples (Subjects 40, 48 and 89) were electrophoresed on a denaturing gradient gel. Bands were excised, sequenced and identified as in the Materials and Methods. Bands are labeled as follows: le = Leptotrichia amnionii; in = Lactobacillus iners; ga = Gardnerella vaginalis; cr = Lactobacillus crispatus; pr = Prevotella amnii (also named P. amniotica). Panel B shows a Venn diagram of the organisms identified by Illumina sequencing of the V6 rRNA region and by sequencing DGGE bands amplified from the V3 rRNA region.

