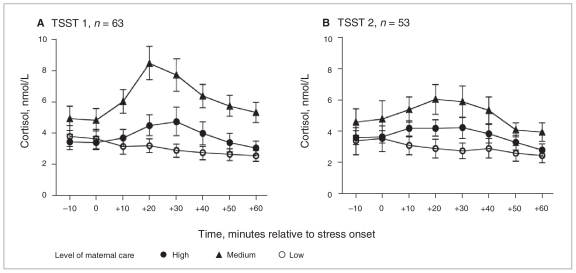
Fig. 1.
Means and standard errors for cortisol levels in high (n = 29), medium (n = 19) and low (n = 15) maternal care groups on (A) testing day 1 and (B) testing day 2 (high n = 24, medium n = 15, low n = 14 maternal care groups). On both testing days, the medium maternal care group displayed the highest cortisol levels. Low and high maternal care groups did not differ from each other. TSST = Trier Social Stress Test.6

