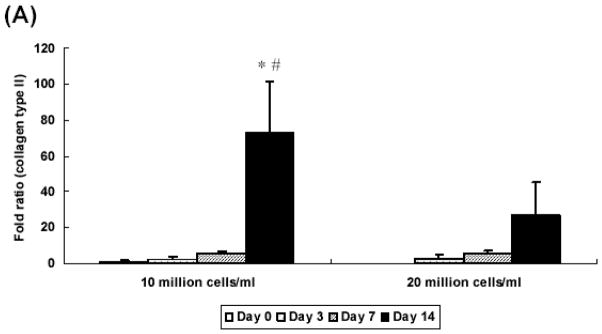
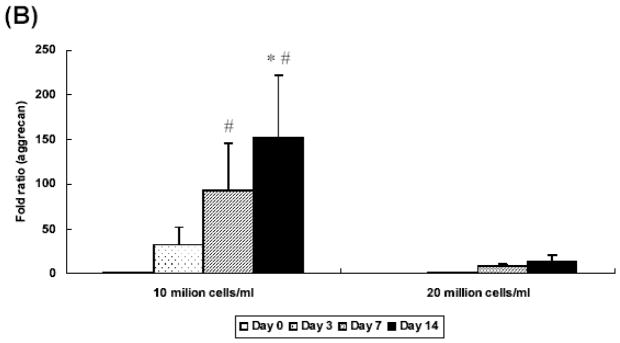
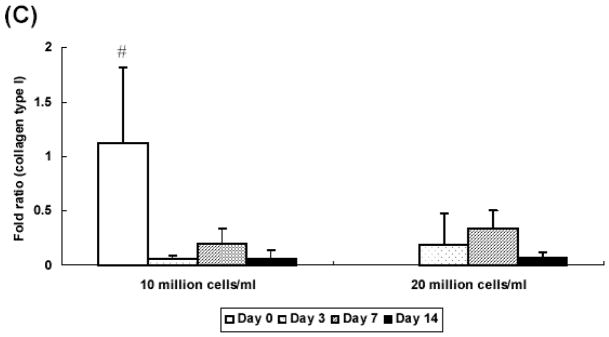
Figure 6.
Quantitative analysis of gene expression for OPF hydrogel composites encapsulating rabbit MSCs and TGF-β1-loaded microparticles with different seeding densities (10 and 20 million cells/ml): (A) Collagen type II; (B) Aggrecan; (C) Collagen type I. Data are presented as fold ratio after normalized to GAPDH. The expression level of controls (Day 0) is represented as one. Within a given hydrogel formulation, significantly higher (p<0.05) gene expression than day 0 values (controls) are noted with (#). Samples indicated with (*) had significantly higher gene expression than the other two groups at the same time point (p<0.05). Error bars represent means ± standard deviation with n = 4.


