
Figure 3.
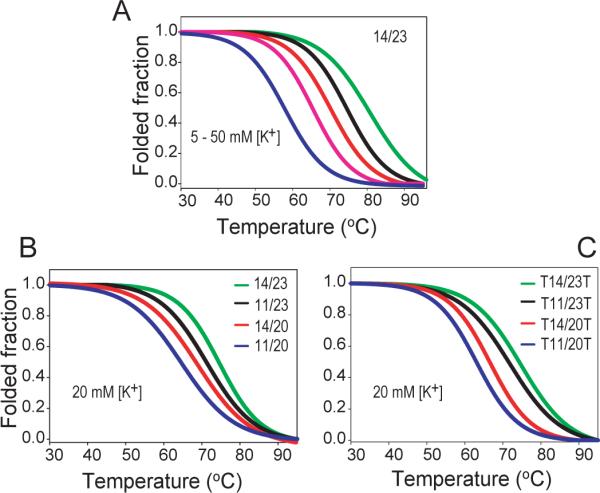
(A). CD melting curves for 14/23 in the presence of 10 mM Li3PO4 (pH 7) and different concentrations of K+ (2 mM to 50 mM, from left to right). 14/23 shows K+ concentration-dependent melting temperatures. The Tm of 14/23 at 50mM K+ concentration is ~80°C. 2 mM [K+], blue; 5 mM [K+], pink; 10 mM [K+], red; 20 mM [K+], black; 50 mM [K+], green. (B) & (C). CD melting curves of 11/20 (blue), 14/20 (red), 11/23 (black), and 14/23 (green) (B) and of the truncated sequences T11/20T (blue), T14/20T (red), T11/23T (black), and T14/23T (green) (C) of four loop-isomers in the presence of 10 mM Li3PO4 (pH 7) and 20 mM [K+]. The 14/23 loop-isomer is shown to be the most stable, followed by 11/23, 14/20 and 11/20. The heating rate of CD melting is 2°C/min.