
Figure 5.
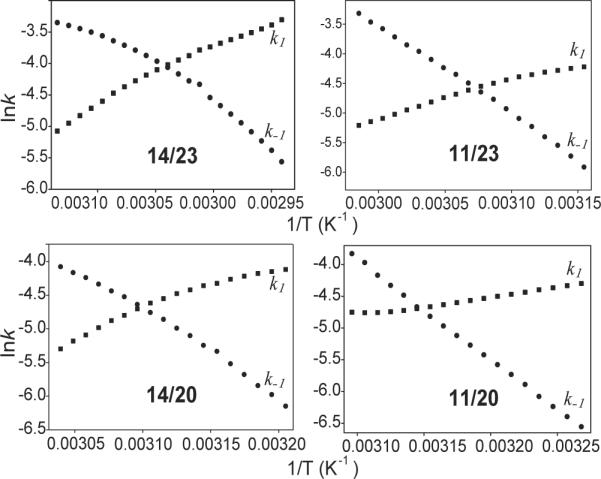
The Arrhenius plots for 14/23, 11/23, 14/20 and 11/20 showing the temperature dependence of the kinetic parameters of the folding and unfolding processes, based on the analysis of the hysteresis between the melting and annealing profiles. The k1 and k−1 values were obtained from the annealing and melting profiles. Using the slopes of these curves, the activation energies of folding and unfolding reactions can be determined. The theoretical melting temperatures can be determined at the intersection of k1 and k−1.curves. k1, squares; k−1, circles. All experiments were performed in the presence of 10 mM Li3PO4, pH 7.0, containing 2 mM [K+], at a cooling and heating rate of 2°C/min.